What makes COVID-19 unique from the perspective of epidemiological dynamics? In this multi-part series, we talk about over-dispersion: notion that a small fraction of infectious individuals/events account for large portion of transmissions. Be ready for some math.
By now, we all have heard of R0 (or Rt). Overall, it’s a really useful parameter particularly for assessing whether infections are growing in # over time. However, over-reliance on this parameter lends to an oversimplified view of an epidemic. (e.g. R0 = 3).
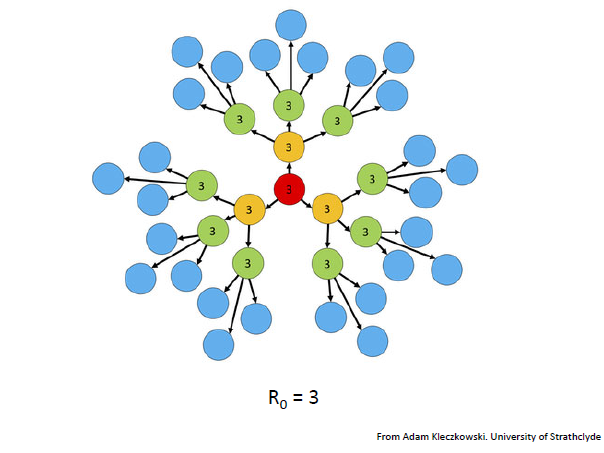
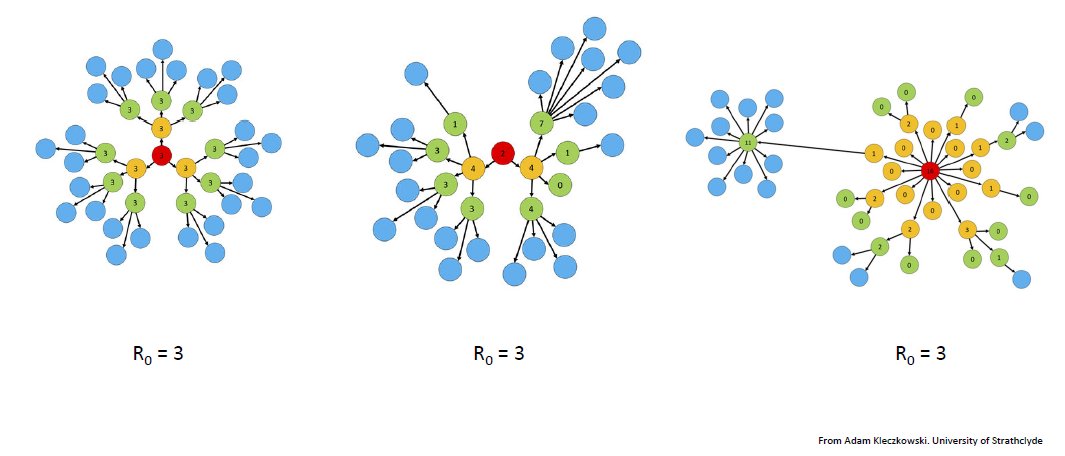
The truth is R0 is merely the AVERAGE # of secondary infections occurring per case. It doesn’t tell us how transmission is varied across individuals or changes with time. R0=3 can present in varied ways:
So what pattern does COVID-19 fit into? We can look at Hong Kong as an example. According to Dr. Dillon Adams (@DrDCAdam ) publication in Nature Medicine (nature.com/articles/s4159 ) from Jan 23-April 28, Hong-Kong identified 1038 confirmed cases (of which 18.8% were asymptomatic). They found 3 major superspreading events:
-
a band that performed at multiple venues,
-
a wedding, and
-
a single monk who infected others in multiple temples.
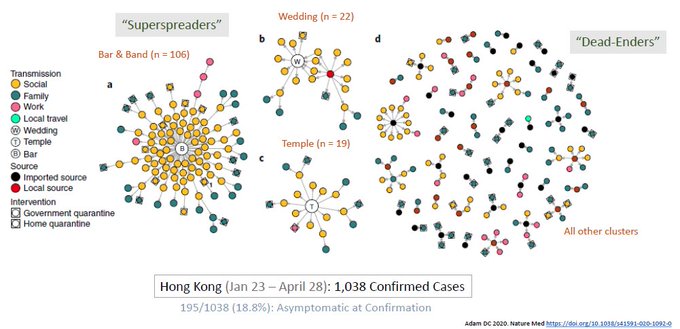
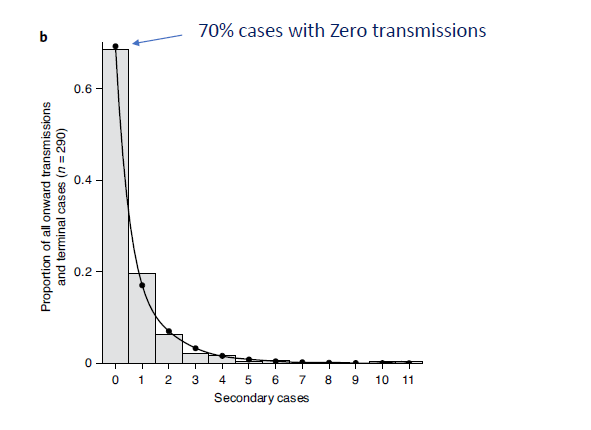
However, if you noticed most other cases led to no subsequent spread. For every “superspreader”, there are multiple “dead-enders” – basically where infection met an end to transmission. In their analysis, 70% cases had ZERO transmissions.