
As noted in Part 1, COVID-19 transmission is over-dispersed. Here we discuss about one method to quantify/characterize the dispersion: Negative Binomial Distribution (NBD).
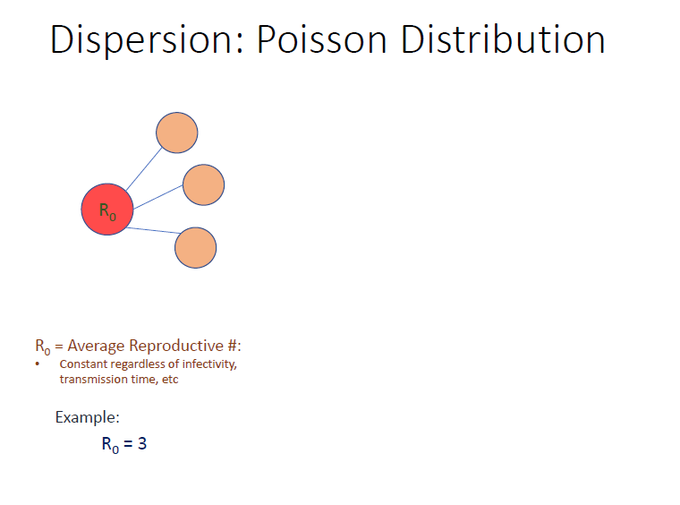
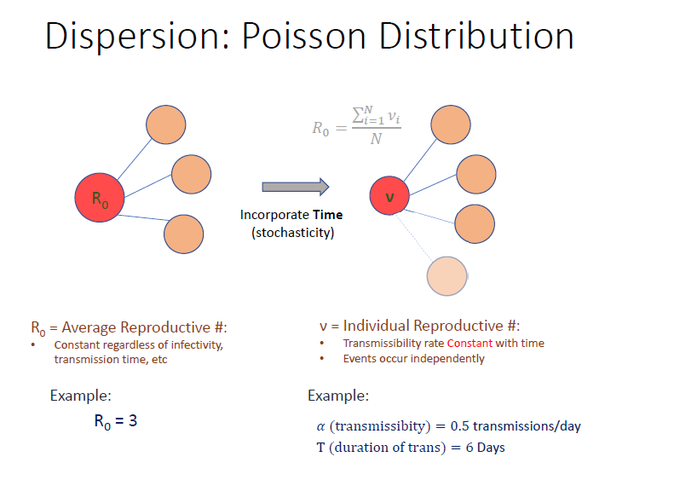
Before we go into NBD, it’s important to know another distribution first: Poisson Distribution. To illustrate relevance of Poisson, take our R0 = 3 example. R0 is the avg reproductive # that is constant without any info re: time of transmission.
But now incorporate Time as a stochastic factor. Make Transmissibility RATE constant, maintained over a given duration. For example, 0.5 transm/day over 6 days (note avg transm = 3), but allow for randomness in time of trans. Individual # transm can be 1, 2, 3 or 4 …
When time stochasticity is extrapolated to a larger population, the pattern of secondary transmissions (prob mass distribution) follow a Poisson distribution. As can be seen most cases infect another 2 or 3 individuals, while >8 transmissions are quite rare.
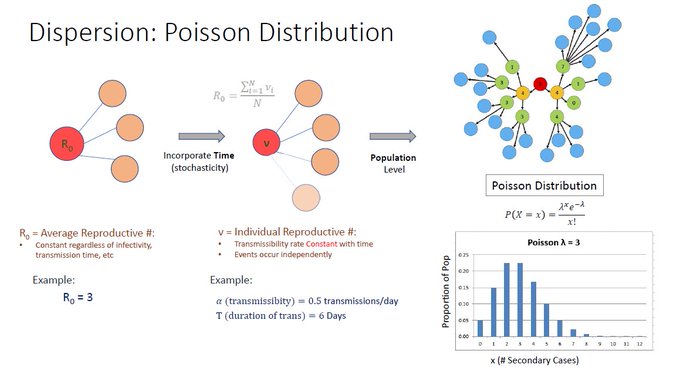
Poisson distribution accounts for time as a factor, but assumes that transmissibility rates are equal across individuals. This is why it has been applied to predicting # of alpha particle release from radioactive elements like Radium. All Radium molecules have same decay rate.
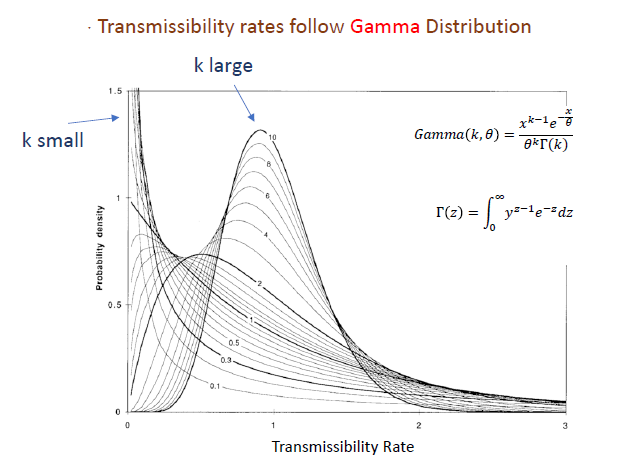
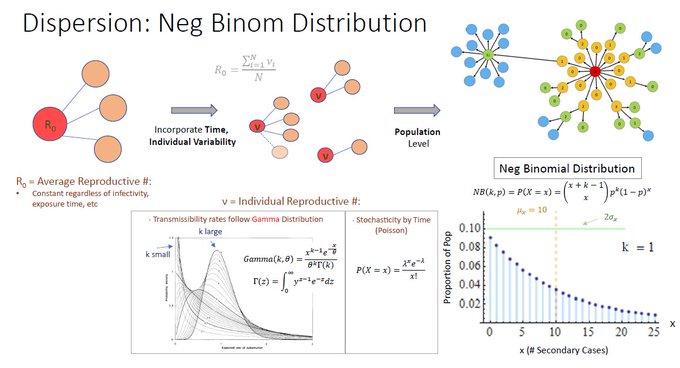
But realistically, transmissibility rates vary across individuals. To mathematically represent this variability, a Gamma Distribution is often used. For this thread, the most important variable is dispersion factor, k.
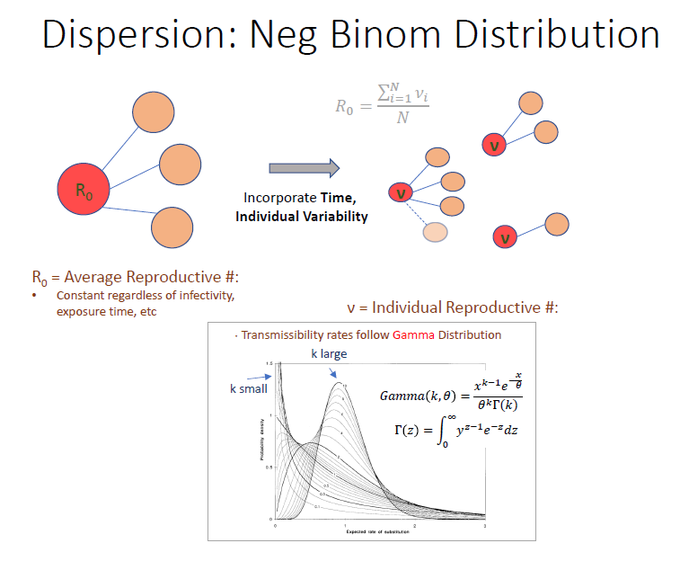
Smaller the “k”, the more dispersed the Prob Density Function is: most individuals have zero transmissibility.
A larger “k”, starts to look more Gaussian while k= inf, all individuals have same transmissibility. So NOTE: lower k = greater dispersion.
Combine this individual variability in transmissibility rate (Gamma) with time stochasticity (Poisson) and extrapolate to larger population, you get the Neg Binomial Distribution! This can be mathematically derived – but importantly dispersion factor k carries over.
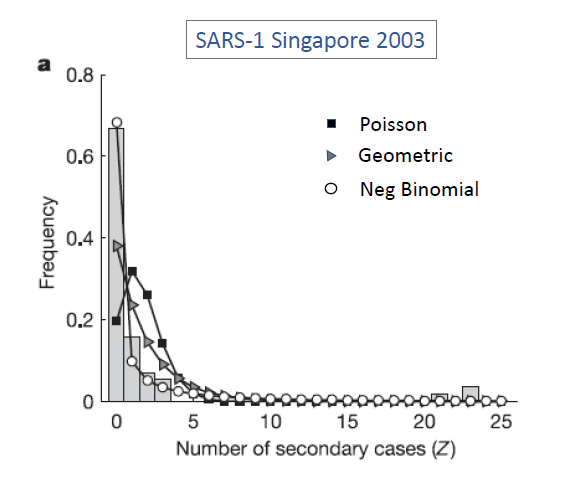
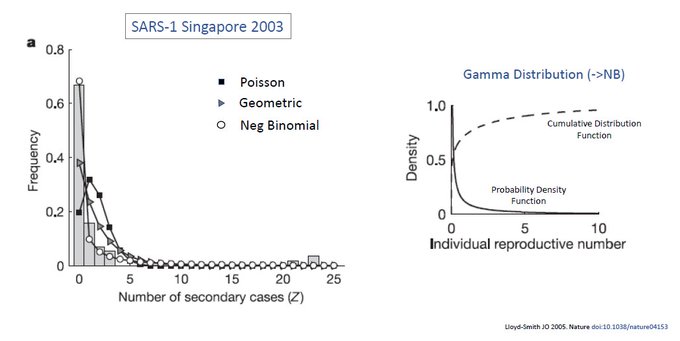
So how did NBD become widely applied to pandemics? One seminal paper published by Lloyd-Smith et al in 2005 (nature.com/articles/natur), looked at # secondary cases in SARS-1 in Singapore and found that NBD was the best fit compared to Poisson and Geometric.
Importantly, based off NBD fit, the author was able to back calculate, get the Gamma distribution and thus the individual reproductive # (or transmissibility rate) for SARS-1.
In summary, NBD evolves from the combination of individual variability (Gamma distribution) and time stochasticity (Poisson) – and is widely used in infectious dx epidemiology. In Part 3, we will look at the estimation of dispersion factor, k, to SARS-CoV-2.