
In Part 2, we talked about NB distribution and factor k – the parameter quantifying dispersion. In this section, we ask: What is the dispersion factor for SARS-CoV-2 and how does this compare to other infections?
To my surprise, I didn’t find too many studies dedicated to this question. In Indonesia, the k for COVID-19 was 0.06 and 0.2 in two separate regions. In Hong Kong, k was 0.43. Endo et al, calculated in a number of countries outside of China and estimated k to be ~ 0.1.
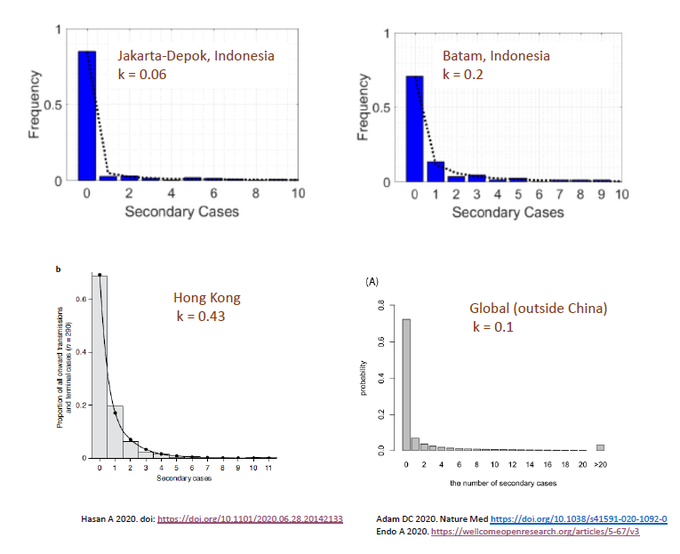
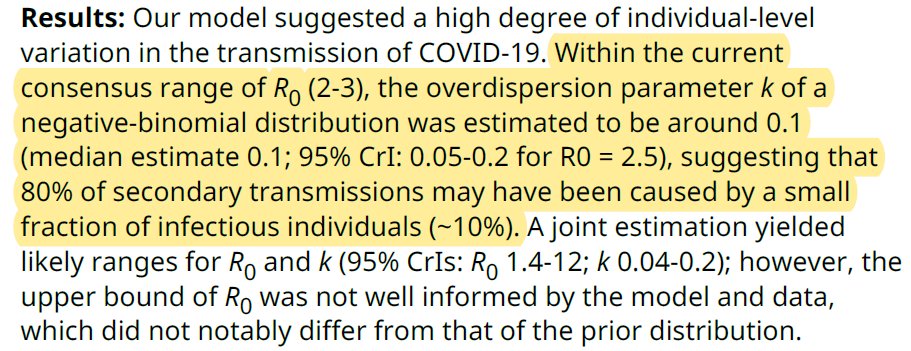
As stated in Part 2, lower k = greater dispersion. Anything < 1 suggests “over-dispersion” or propensity for superspreading. According to Endo (wellcomeopenresearch.org/articles/5-67/) ” ..80% of secondary transm may have been caused by a small fraction of infectious individuals (~10%).”
In Hunan province, China, the k was calculated to be 0.3 – where “80% of secondary infections were traced back to 15% of SARS-CoV-2 primary infections, indicating substantial transmission heterogeneities.” science.sciencemag.org/content/early/

In summary, k ranged from 0.02-0.65. Since k was consistently < 1, COVID-19 transmission is overdispersed w/ small # of individuals contribute to large # of transmissions. So, does this make SARS-CoV-2 unique compare to other pathogens?
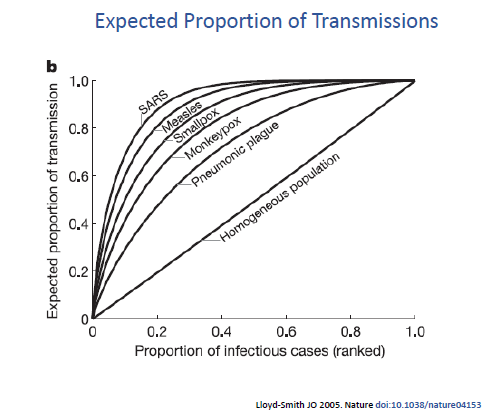
Lloyd-Smith et al 2005 (nature.com/articles/natur), compared the dispersion factor between various infectious agents – and incorporated SARS-1 which share similar (albeit slightly greater) dispersion as SARS-CoV-2.
They found that a smaller proportion of SARS-1 contributed to a greater proportion of infections when compared to measles, smallpox, or pneumonic plague (bubonic). A completely homogeneous spread would plot to diagonal line while more dispersed infections inch to the left.
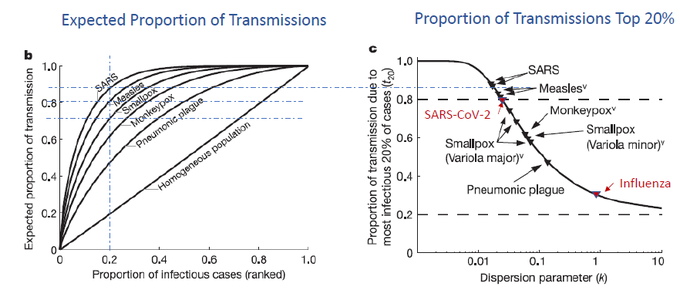
If we focus on the top 20% most infectious and map out their proportion of transmissions, we see that top 20% SARS-1 cases lead to ~ 83% transmissions. This is similar to SARS-CoV-2 … whereas 1918 Flu has a k~1 and seasonal flu k~2 (doi.org/10.1371/journa).
SARS-CoV-2 may indeed be unique in being overdispersed. However, as we may tend to oversimplify R0, we might also be prone to oversimplifying dispersion factor, k. So, some caveats:
For one, much more difficult to determine than R0. Taking @kj_seung‘s great contact tracng thread (twitter.com/kj_seung/statu): at #1’s work, 4 other employees got infected. But how? Did #1 infect all 4 or did she infect #7 who infected others? k differs b/w these two answers.

Second, k is dynamic and can change w/public policy. E.g., in Lau et al 2020 paper (doi.org/10.1073/pnas.2) the k in 5 counties in Georgia changes pre-shelter-in-place order (Period 1), 2 wks in (# 2), or > 2 wks afterward (# 3).
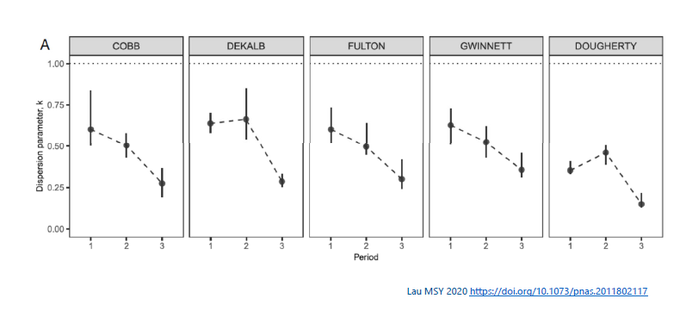
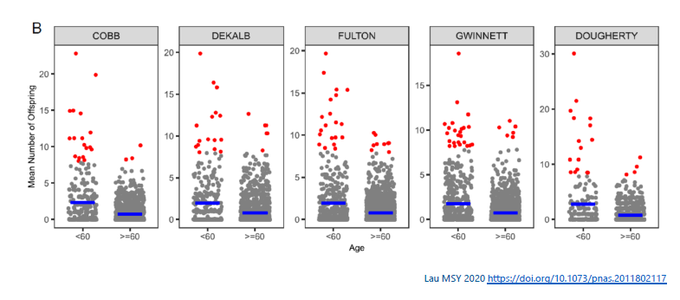
Third, it can depend on the population group. In Lau’s study, younger age group (< 60 yr) tended to have cases with greater # of offsprings (k smaller). For example, in Cobb county, k 0.53 for younger vs. 0.82 for older age group.
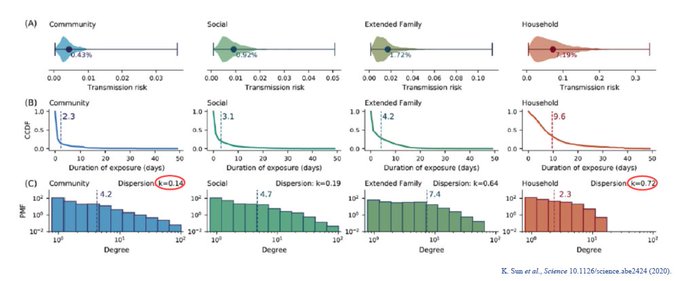
Finally, k can vary w/settings. k tend to be lower in settings where there is greater exposure time. In households, for instance, greater exposure leads to greater chance of infections to other members. k in households > k in community.
Nevertheless, for COVID-19, transmission appears consistently over-dispersed 0<k<1: quite different from influenza. In future sections, we will discuss the implications of this. But the next Part will discuss the other dispersion analyses: Extreme Value Theory.